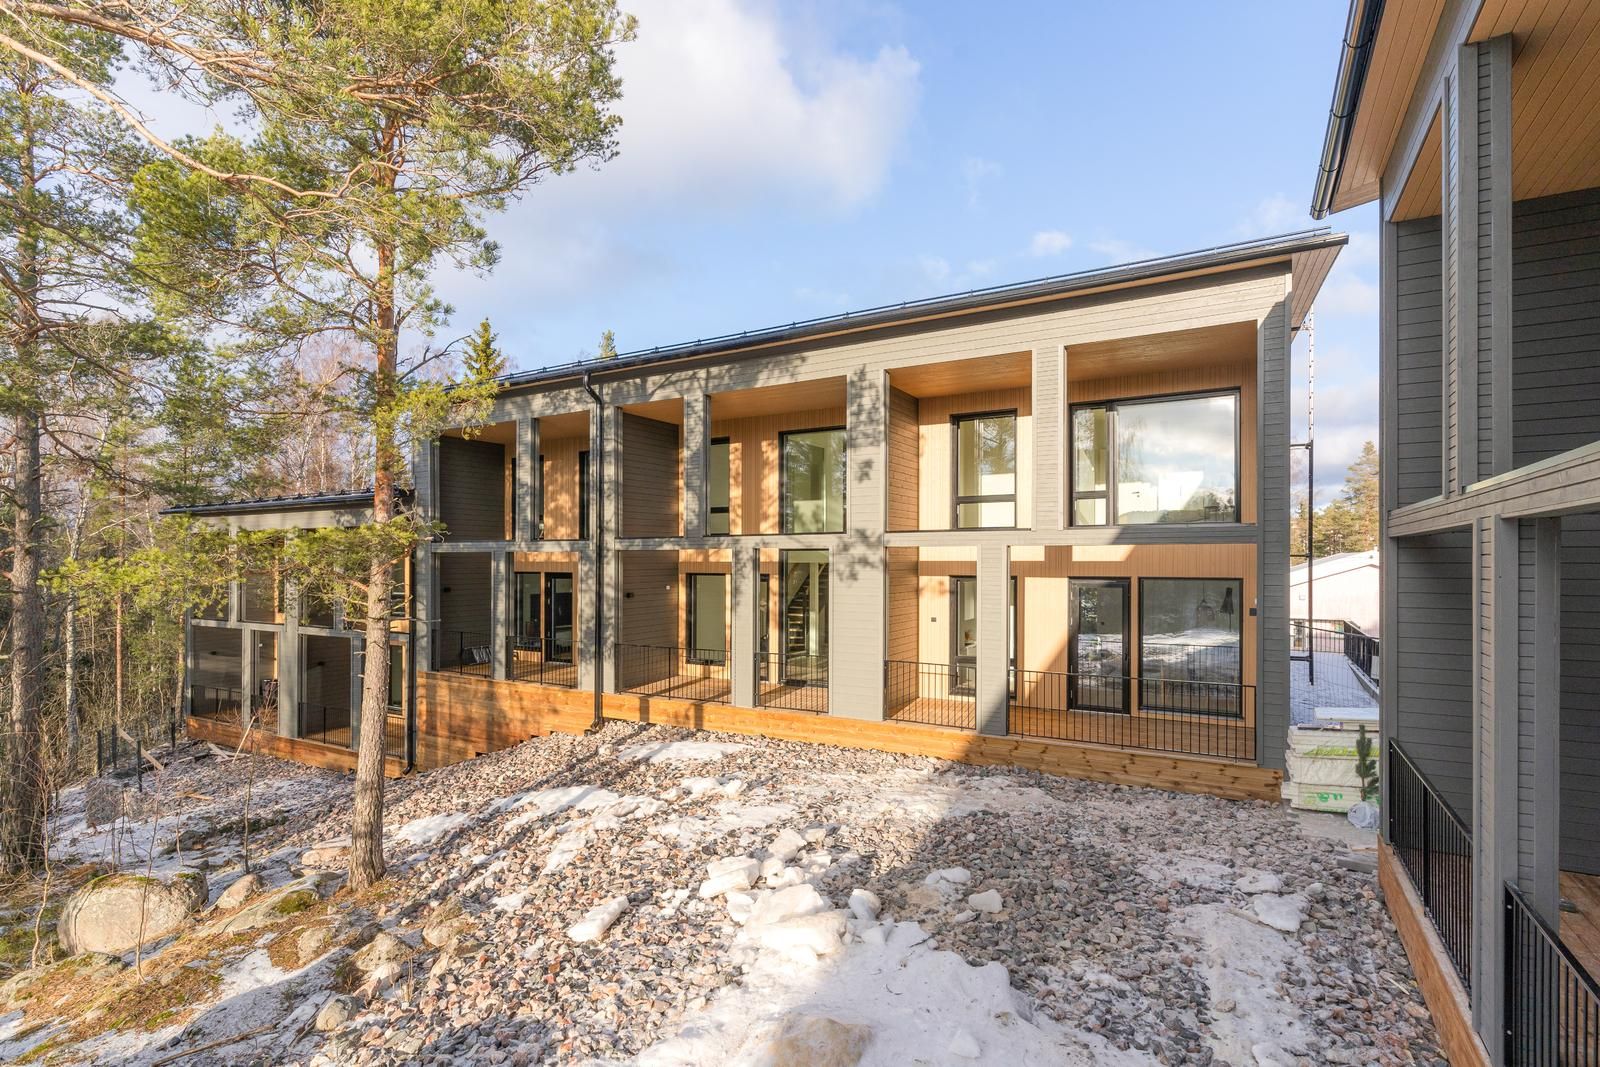
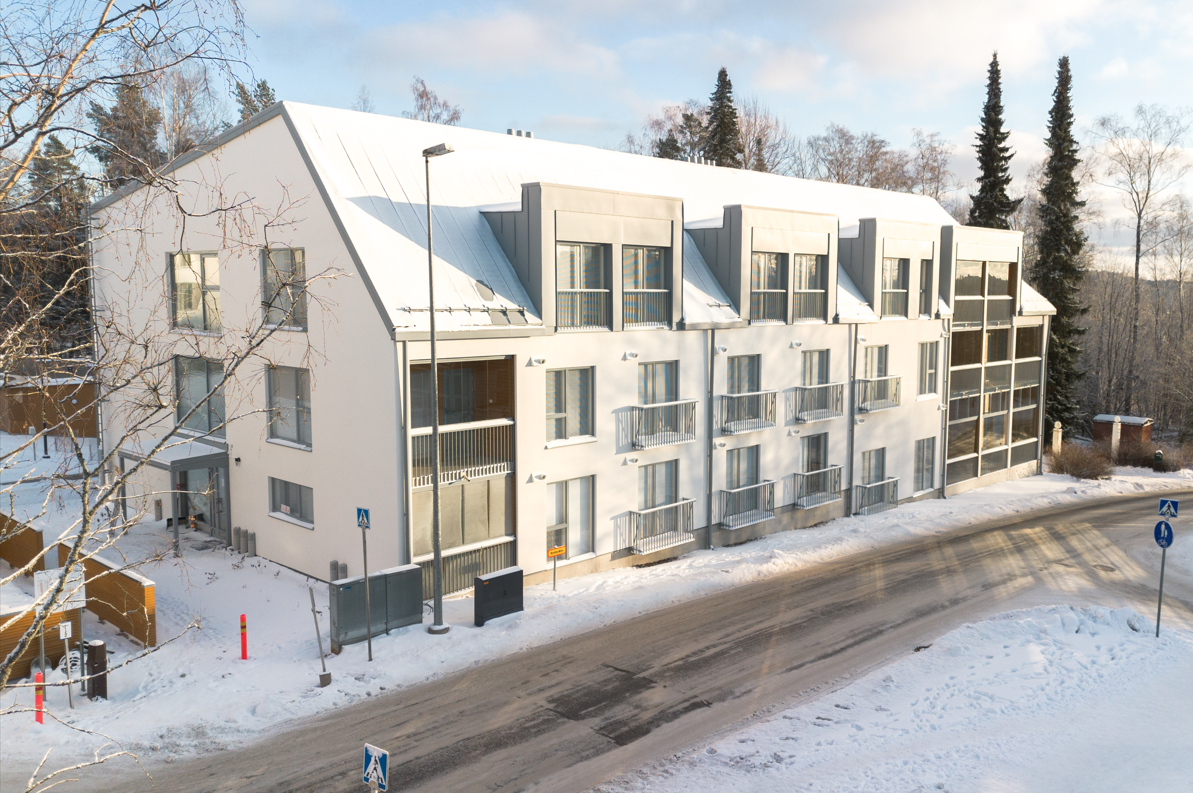
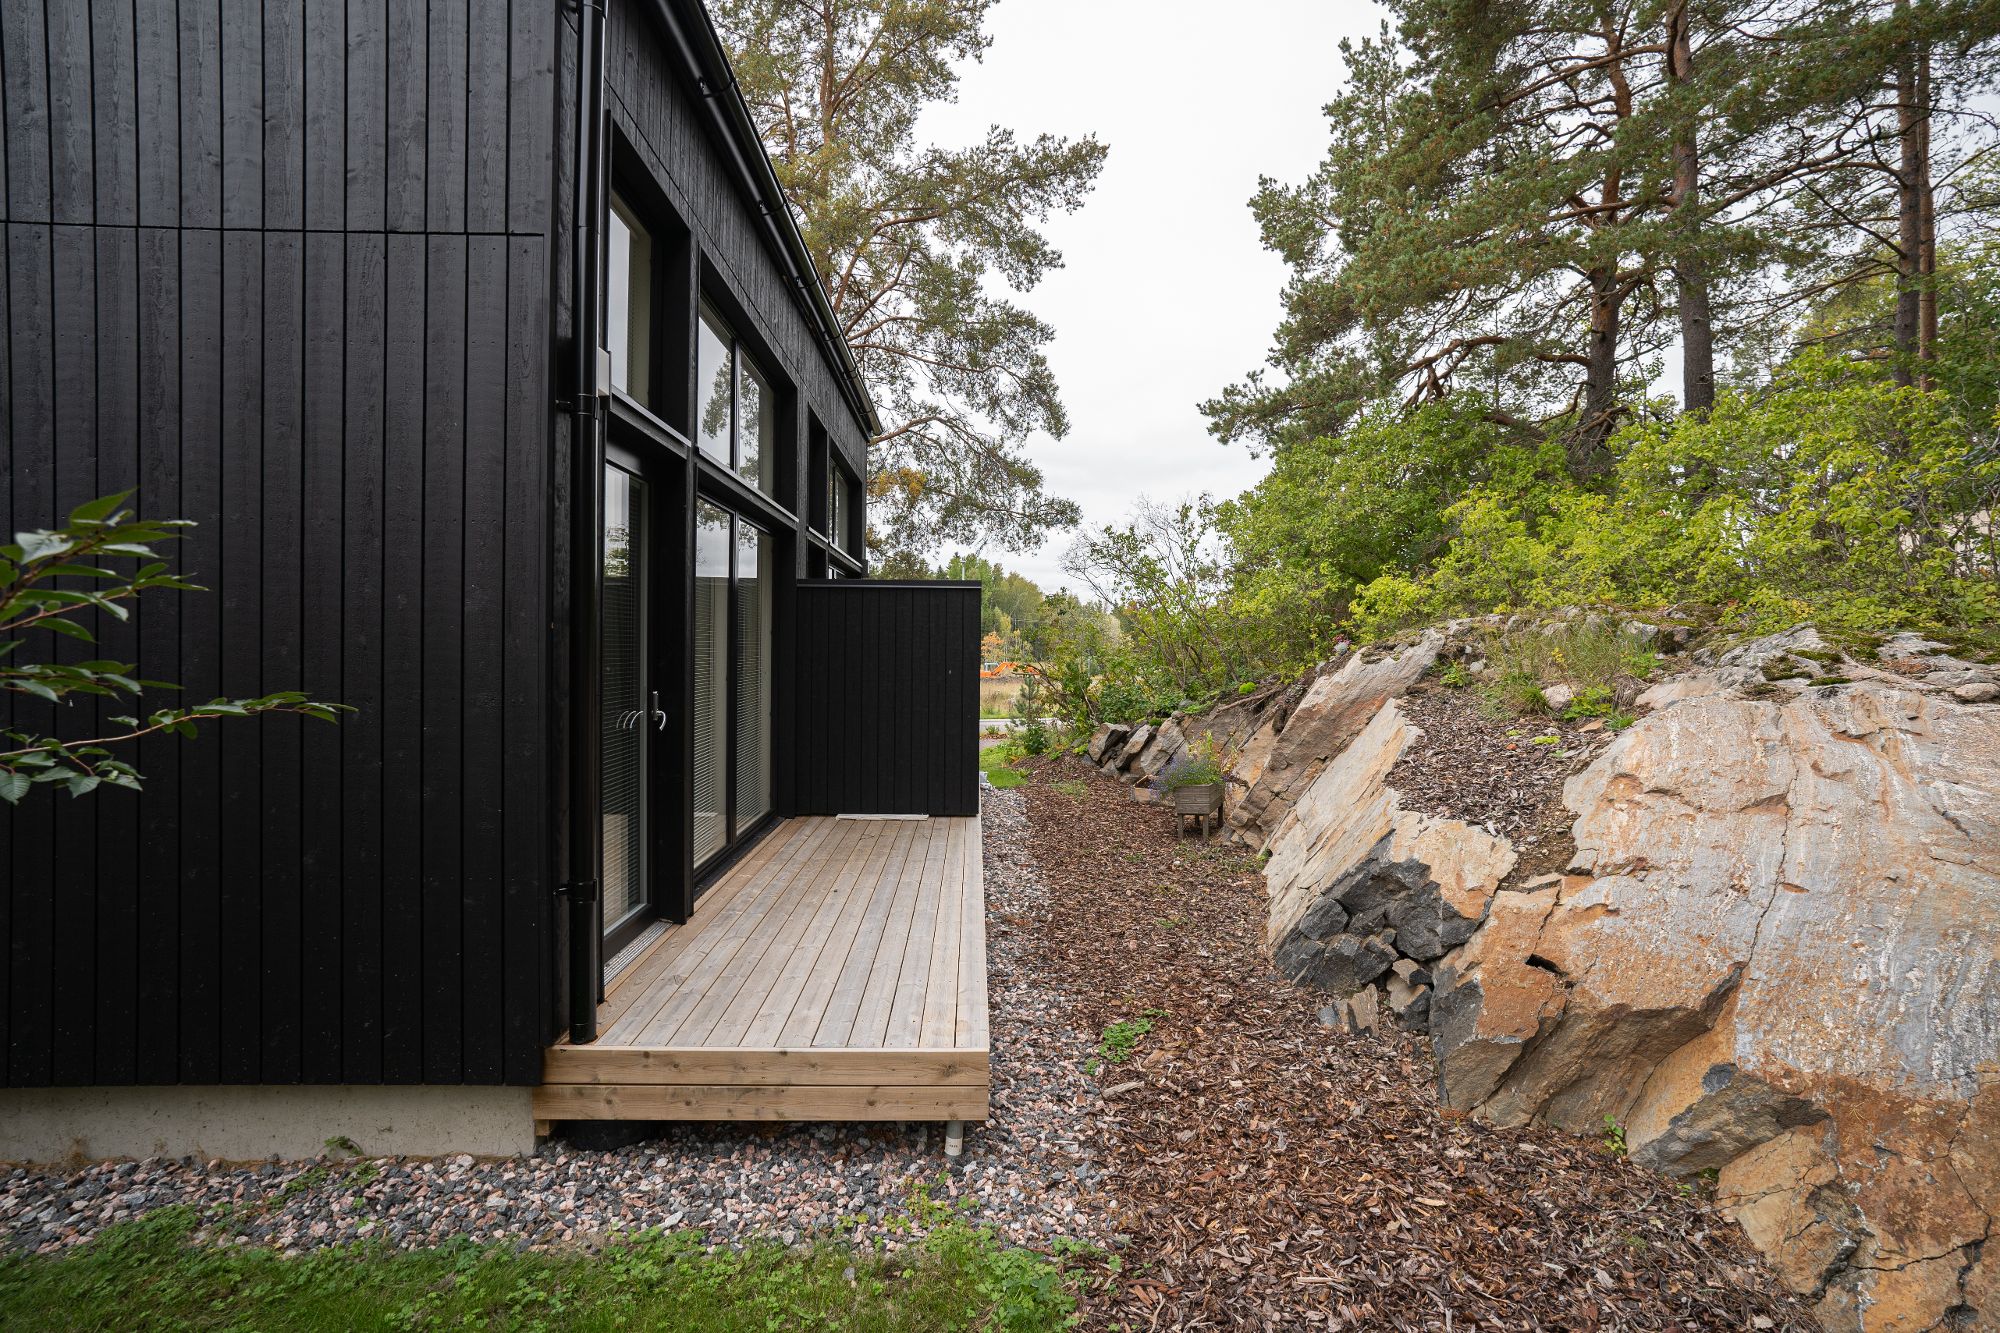
Market

Market

Development of residential property prices

Over the past decade the prices of Finnish residential properties have been rising stably. The price rise has, however, been unevenly distributed between growth centers and the rest of Finland.

Between 2010 and 2020, the prices of residential properties in Finland as a whole increased by an average of 9.2% while the prices of residential properties in Helsinki, Tampere and Turku went up by an average of 25.9%1).

For Finland as a whole, this means an average annual growth rate of 0.9% compared to the average annual growth rate of 2.3% in the Helsinki, Tampere and Turku regions.

Graph: Indexed price development of residential properties 2010-2020 add

Rent development

The rent levels in Finland as a whole and also in the Helsinki, Tampere and Turku regions have increased significantly over the last five years. Between 2015 and 2020, monthly rents of dwellings in the whole of Finland rose by an average of EUR 1.92/m2, which corresponds to an increase of about 15.9%3).

Over the same period, monthly rents of dwellings in Helsinki, Tampere and Turku increased by an average of EUR 2.38/m2, corresponding to an increase of approximately 18.1%4).

Graph: Development of rent levels in Finland 2015-2020 add

Income disposable for housing

In 2016, a total of 59% of the Finnish population were either low or lower average income earners, which means that their monthly disposable income was EUR 0-2,2365).

In total 48% of tenants in the private rental market spent more than 40% of their income on housing in 20186). Thus, achieving lower housing costs is an ideal target for many Finns.

Picture: Income brackets of the Finnish population add

Sources add

1Source: Statistics Finland (Price indices of old dwellings in housing companies, annual, 1988-2020).
2Source: Statistics Finland (Price indices of old dwellings in housing companies, annual, 1988-2020).
3Source: Statistics Finland (Rent index and average rents per square meter, annual 2015-2020)
4Source: Statistics Finland (Rent index and average rents per square meter, annual 2015-2020)
5Source: Finnish Business and Policy Forum EVA, Me olemme keskiluokka (We are the middle class), May 2018
6Source: The Ministry of the Environment, Asuntopolitiikkaa Euroopassa – Mitä voimme oppia? (Housing policy in Europe – What can we learn?), December 2020.

Market trends

null

  • Population growth concentrates to the largest cities
  • Living in rental apartments becomes more common
  • Number of small households grows
  • Finnish housing stock ages

In its projects Toivo aims to respond market trends by focusing its strategy on new, small and efficient affordable housing in the Helsinki, Turku and Tampere regions.

Competitive landscape

According to Toivo’s management Toivo's competitive landscape can be divided into two main groups:

  1. Players focusing on business premises that operate with the "develop and own" business model
  2. Players focusing on residential properties that in turn focus on an ownership business model

The prevailing market situation has left an attractive market niche for an operator like Toivo that focuses on the development and long-term ownership of residential properties.

According to Toivo’s management Toivo has revolutionised the operating model for residential property ownership and thus created a significant competitive advantage for itself compared to other players. The key differences compared to other players are the low average age of Toivo's dwellings, the fact that the residential properties are primarily located in the capital region and Tampere and Turku regions, the on average small size of the dwellings and low average monthly rents of the dwellings. Toivo believes the average age of its dwelling portfolio will remain younger than for its competitors in the near future as the company implements its strategy to build new dwellings in accordance with its project development portfolio and as its current dwelling portfolio is clearly smaller than among its competitors measured by the number of dwellings.

Key figures

View our financial development

Strategy

Read about our strategy